.png)
.png)
.png)


.png)
Datarock compared its output of fracture count and frequency, auto-generated from core photography, to manual logging, using 45,000m of historical core photography taken between 2011-2013 from BHP’s Carrapateena deposit.
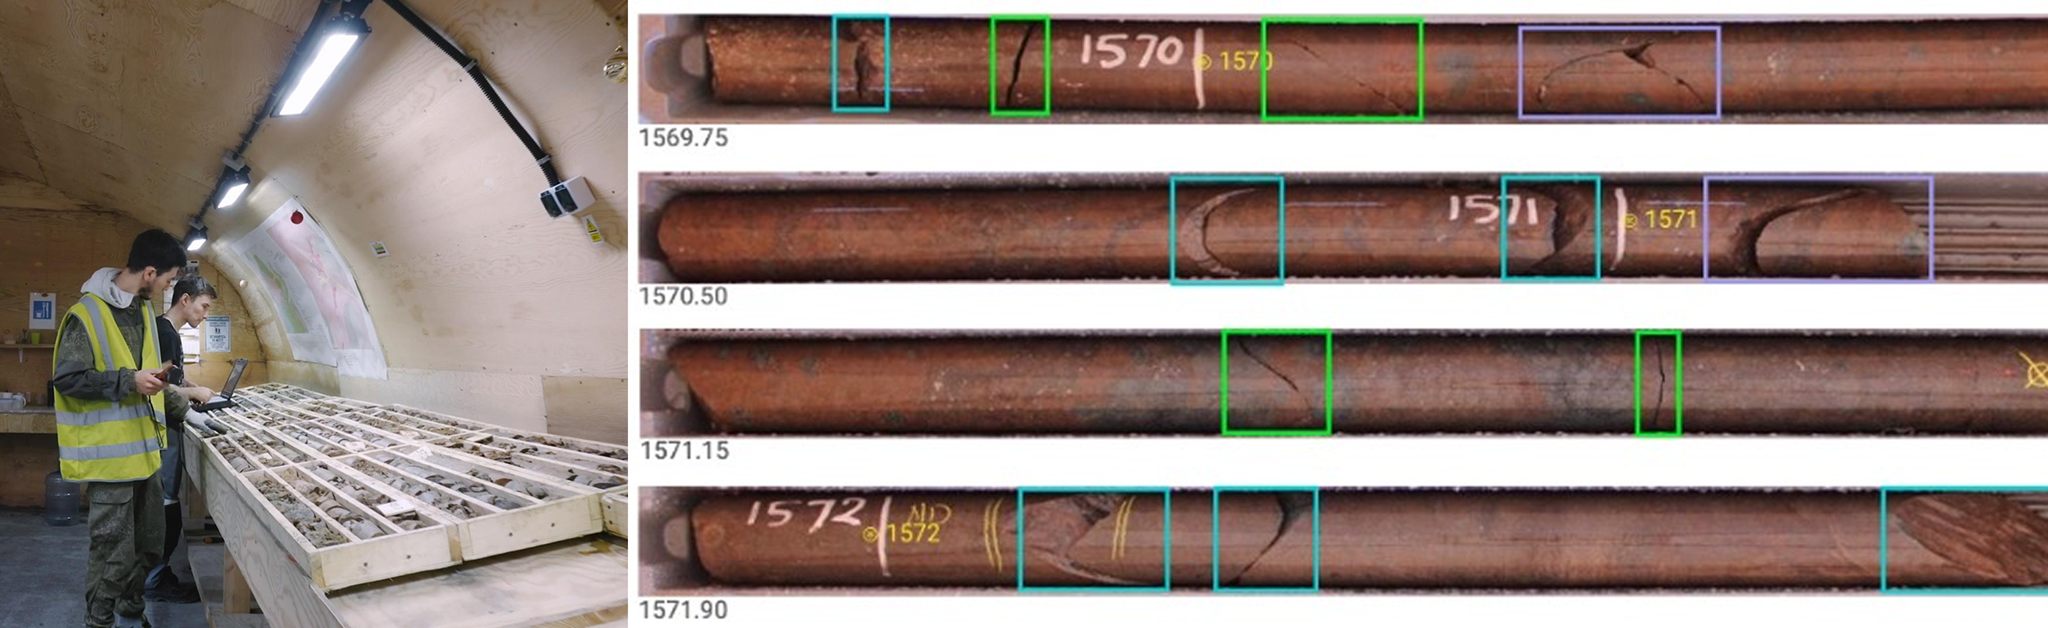
Using the Datarock Platform, we converted raw core photography into analysis-ready images. These images were then processed through computer vision pipelines to detect fractures and broken rock.
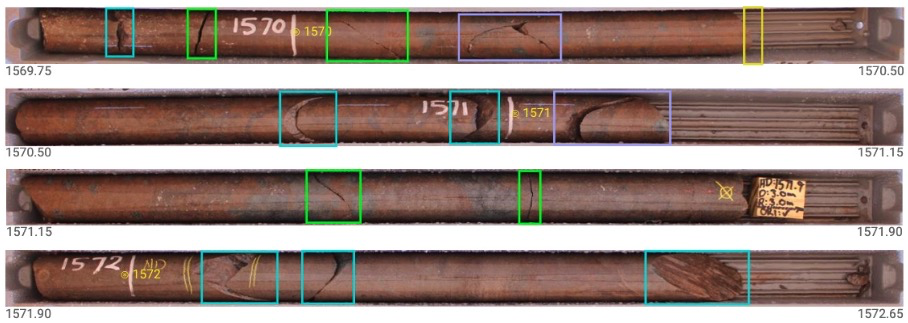 Example fracture detections.
The method involves detecting induced (mechanical) fractures from natural fractures in core imagery using an object detection model trained to identify driller’s break marks on the core. For fracture frequency calculation, outputs from fracture detection/classification and driller’s break models are combined. Due to the high density of fractures in broken zones, 'equivalent fracture counts' are introduced, with simple fractures being counted as one. This system allows for a more accurate analysis of fracture data in core samples.
Predicted Fracture Frequency versus Manually Logged Fracture Count
A comparison dataset was created to analyse fracture metrics across various drill holes. Two seasoned geologists manually logged the intervals using core photography, which was then used to calculate fracture count, equivalent fracture count, and fracture frequency. Despite minor variations between the logged and predicted data - due to different interpretations of broken rock intervals - a strong correlation was found.
If automated methods, like those demonstrated in this comparison, can generate datasets matching the quality of experienced loggers, it could significantly enhance data collection by improving coverage, efficiency, and quality assurance.
In the experiment, the Datarock workflow effectively detected, classified and extracted fracture data from the 12-year-old core photography. When tested on the Carrapateena IOCG deposit imagery, the automated method yielded results comparable, those of the experienced geotechnical loggers with a high level of consistency.